Deux écrans permettent de visualiser l'utilisation du cache.
Pré-requis
Pour utiliser les fonctionnalités décrites sur cette page, il est nécessaire de l'activer dans l'écran de configuration de l'espace d'administration. Il faut renseigner la catégorie Statistiques du cache ainsi que la Connexion à la base de données de monitoring. Cette configuration doit être faite pour l'application CMS (back) et l'application SITE (front). Si vous ne configurez que l'application CMS, vous n'aurez pas accès au statistique du cache.
Statistiques sur le cache dynamique
Ce cache stocke les éléments de pages (contenus, services) en mémoire vive. Les pages ayant des éléments dynamiques sont ainsi servies plus rapidement par le CMS lorsqu'elles sont partiellement déjà en cache.
Cet écran permet de visualiser les statistiques d'accès aux pages et aux éléments des pages sur le CMS.

Les statistiques peuvent être filtrées par contexte d'utilisation du cache:
- CMS
- Prévisualisation
- Version en ligne
- Site
Cliquez sur un contexte pour visualiser ou masquer les statistiques de ce dernier.
Les statistiques affichées sur chaque ligne sont le cumul des sous-éléments de l'arbre : pour une page donnée on y lit donc les statistiques de la page mais aussi de ses sous-pages.
Pour voir le détail d'une page ouvrez le sous-élément 'Détails'. La colonne "Cacheable" représente le taux d'éléments des pages qui peuvent être mises en cache, pondéré par le nombre de hits par élément : le pourcentage obtenu est donc comparable à la colonne "Efficacité".
Une efficacité de 0% est probablement synonyme d'une cache dynamique désactivé dans la configuration générale.
Exemples d'analyse de l'utilisation du cache
Zoom sur la page "index.html" en mode prévisualisation

Dans cet exemple, la page "index.html" a été demandé 5 fois. Sur 35 éléments de pages, 28 ont été servis par le cache, d’où une efficacité de 80% du cache.
La page est 100% cacheable, ce qui signifie que tous les éléments qui la compose sont cacheache. Dans le détails on peut voir que ces éléments sont un contenu, un service et 5 input data.
Zoom sur la page "newsletter.html" en mode prévisualisation
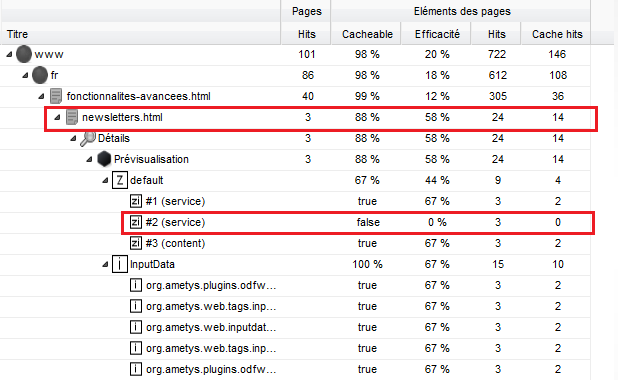
Dans cet exemple, la page "newsletter.html" a été demandé 3 fois. Sur 24 éléments de pages, 14 ont été servis par le cache, d’où une efficacité de 58% du cache.
La page n'est cacheache qu'à 88%. En effet dans le détail des éléments qui la constitue, on peut voir qu'un service ne peut être mis en cache.
Statistique sur le cache statique
Ce cache stocke les pages complètes (lorsqu'elle sont cacheables dans leur ensemble) sur disque dur. Les pages sont servies par les applications front-office ou directement par un serveur http (comme Apache Httpd).
Cet écran permet de visualiser les statistiques d'utilisation des caches sur le site.
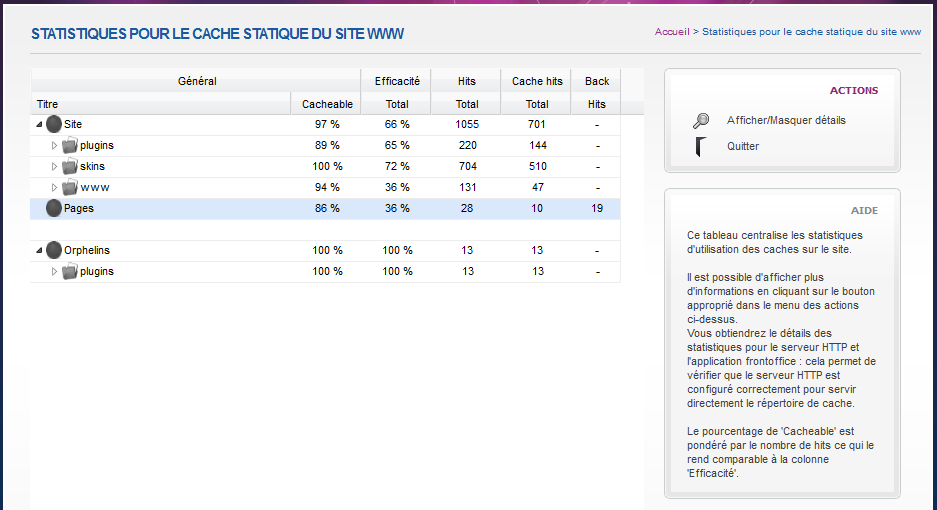
Il est possible d'afficher plus d'informations en cliquant sur le bouton "Afficher/Masquer les détails". Vous obtiendrez le détails des statistiques pour le serveur HTTP et l'application frontoffice : cela permet de vérifier que le serveur HTTP est configuré correctement pour servir directement le répertoire de cache.
Le pourcentage de "Cacheable"est pondéré par le nombre de hits ce qui le rend comparable à la colonne "Efficacité".
Exemple : zoom sur la page "index.html"
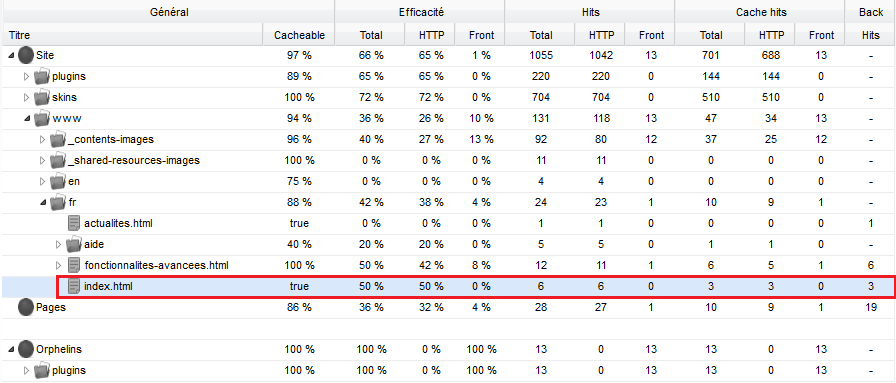
La page "index.html" a été demandée 6 fois à Apache. Sur ces 6 fois elle a été prise 3 fois dans le cache statique (d'où une efficacité de 50%), et 3 fois la requête a été transmise au back-office.
Il est possible d'avoir une petite incohérence entre les chiffres du front et du back-office car chacun effectue sa propre "temporisation" des statistiques.
Important
Les statistiques sur les caches sont mises à jour toutes les heures.