Introduction
Dans l'onglet Exploitation de l'espace d'administration, il existe 3 outils qui vous permettent de vérifier l'état du système et d'en consulter les performances :
- Général, pour consulter l'état général du système,
- Propriétés, pour visualiser les propriétés système de lancement de la machine virtuelle java,
- Monitoring, pour visualiser les courbes de suivi de l'état du système.
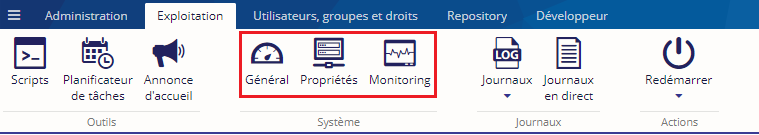
Cliquez sur l'un des 3 boutons pour en afficher les détails.
Général
L'outil Général recense des informations globales concernant le serveur déployant l'application :

La rubrique Système renseigne système d'exploitation, le type des processeurs, et la date serveur.
La rubrique Java donne des informations sur la version de Java installée et la date de démarrage.
La rubrique Ametys renseigne le chemin d'accès au répertoire contenant toutes les données internes d'Ametys.
La rubrique Utilisation de la mémoire représente l'état courant de la mémoire :
- Principale: C'est la mémoire qui est utilisée pour stocker les objets Java. En général, c'est de cette mémoire dont on a l'habitude de parler. Sur la JVM de Sun, cette mémoire est configurable à l'aide des paramètres -Xmx et -Xms.
- Interne: C'est une mémoire secondaire moins connue utilisée pour charger le code de l'application dans la JVM. Il est parfois nécessaire de modifier cette valeur si vous chargez beaucoup d'applications dans votre moteur de servlet. Cette mémoire est configurable à l'aide des paramètres -server ou -XX:[MaxPermSize].
Pour plus de détails à propos de la configuration de la JVM, reportez à la documentation JDK6/Virtual Machine.
L'icône représentant une "Corbeille" située à droite de la section "Mémoire Principale" vous permet de forcer le nettoyage de la mémoire (garbage collecting). Cette fonctionnalité permet, par exemple, de mettre en évidence de possible fuite de mémoire.
La rubrique Traitements du serveur détaille la façon dont le serveur est actuellement sollicité:
- Sessions ouvertes : Affiche le nombre d'utilisateurs ayant utilisé l'application récemment. (La connexion à l'interface d'administration est aussi comptabilisée).
- Requêtes en cours : Affiche le nombre de requêtes en cours de traitement (ce total inclut la requête affichant cet écran).
- Threads en cours : Affiche le nombre total de thread dans la JVM. Cela donne un bon indicateur sur le nombre de requêtes traités simultanément.
Une étiquette s'affiche pour vous alerter en cas d'interblocage (deadlock) sur un Thread.
N'oubliez pas que la mémoire est partagée parmi tous les applications déployées dans le moteur de servlets.
Propriétés
L'outil Propriétés vous permet de visualiser les propriétés système de lancement de la machine virtuelle java :
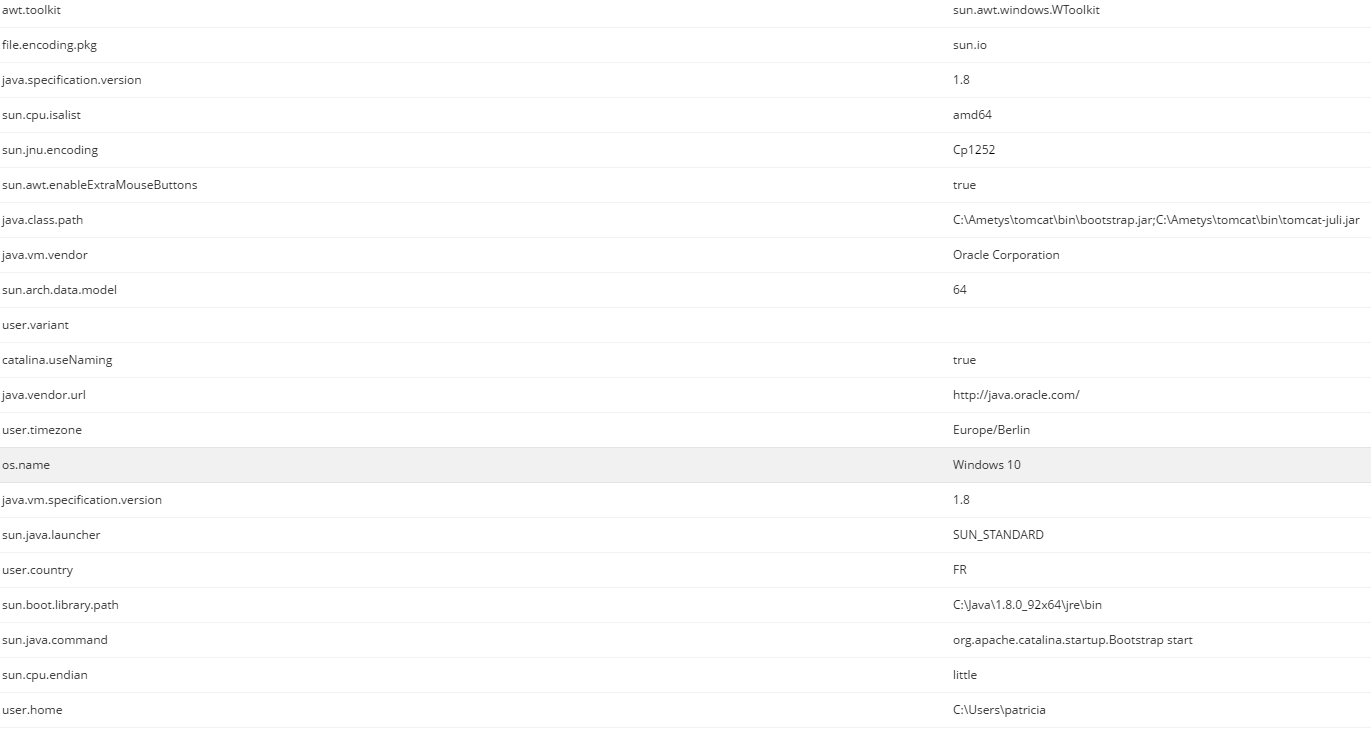
Quelques propriétés intéressantes :
-
java.io.tmpdir : Chemin vers le répertoire temporaire sur le serveur.
-
file.encoding : Encodage de caractères utilisé par défaut par Java.
Monitoring
L'outil Monitoring vous permet de visualiser les courbes de suivi de l'état du système. Sélectionnez le graphe que vous souhaitez étudier dans la colonnes de gauche :
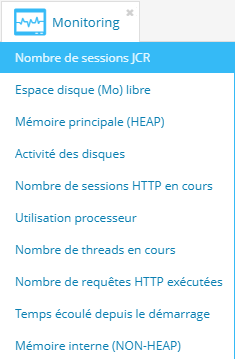
Le graphe demandé s'affiche dans la partie droite de l'écran :
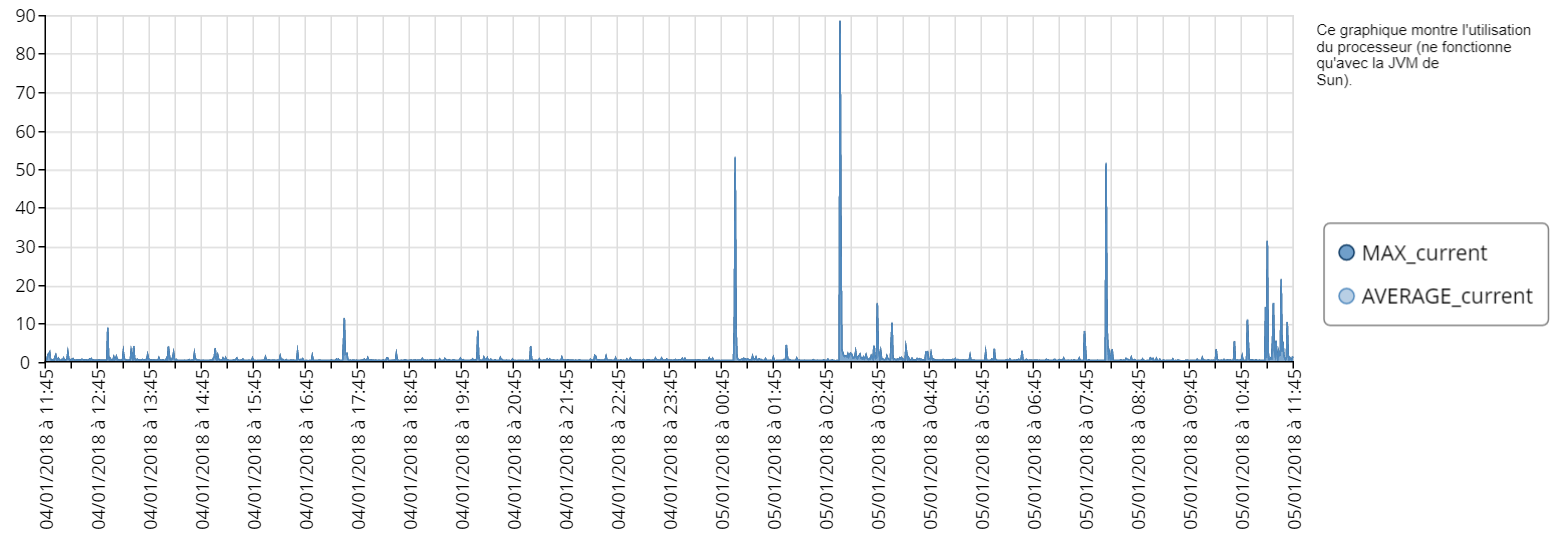
Vous pouvez maintenir le clic de votre souris enfoncé et glisser vers le haut, le bas, la gauche ou la droite. Ces actions ont pour effet de changer l'échelle du temps de chacun des graphiques (de la dernière heure à la dernière année).
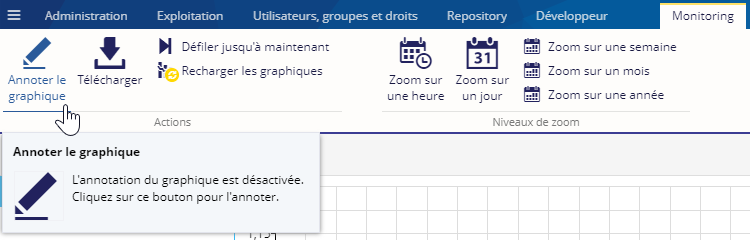
Annoter un graphique
Vous pouvez annoter un graphique. Pour cela, activez l'annotation du graphique en cliquant sur le bouton Annoter le graphique :
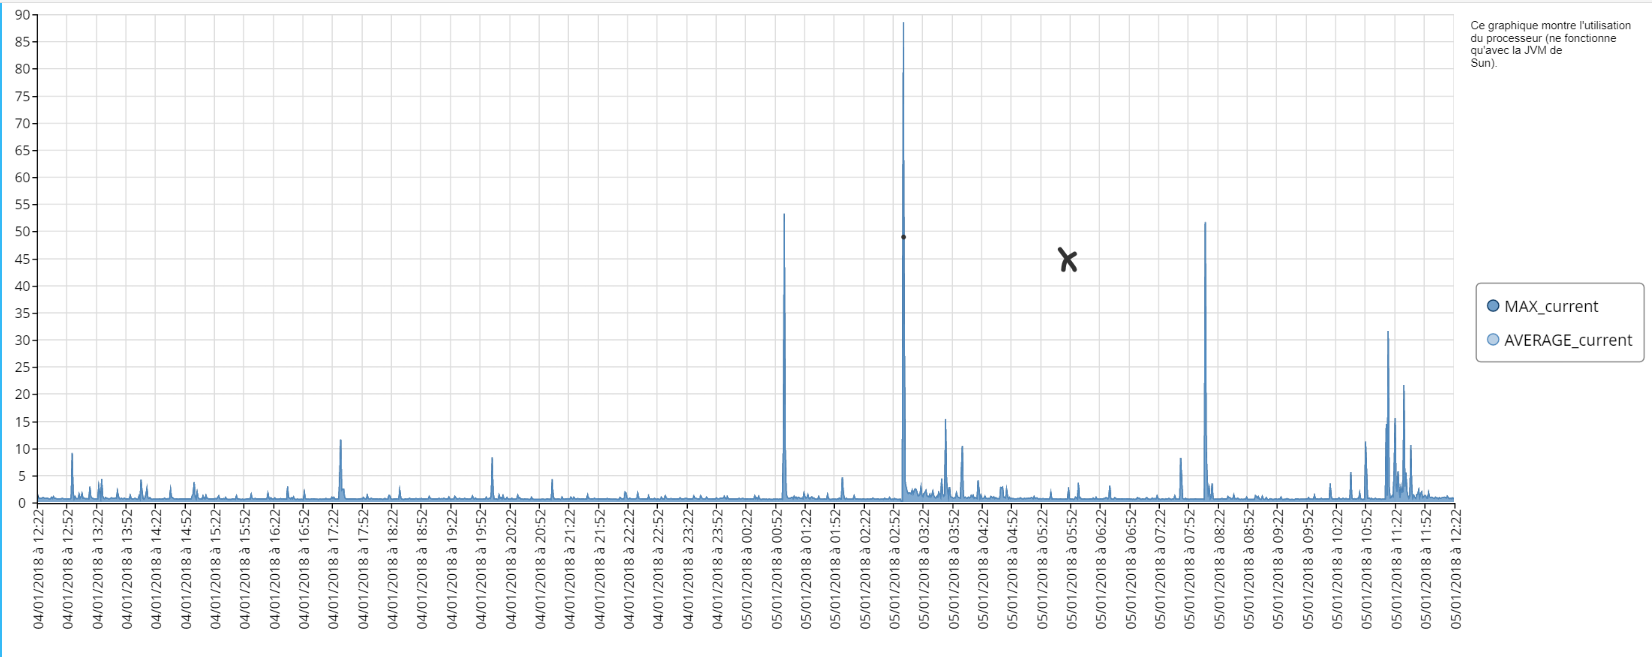
Vous pouvez ensuite dessiner sur le graphique grâce à un stylet :
Lorsque l'annotation du graphique est activée, vous ne pouvez plus définir le zoom des graphiques ou défiler jusqu'à maintenant.
Pour désactiver l'annotation du graphique, cliquez une nouvelle fois sur le bouton.
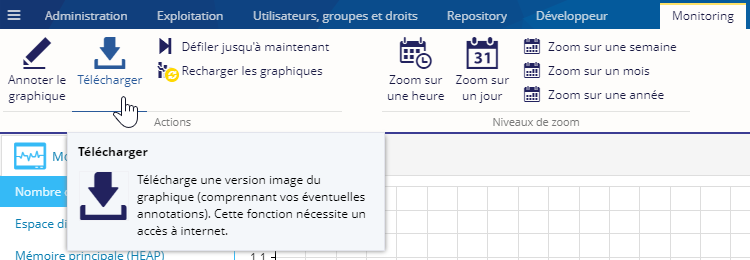
Télécharger un graphique
Vous pouvez exporter unue graphique au format PNG en cliquant sur le bouton Télécharger :
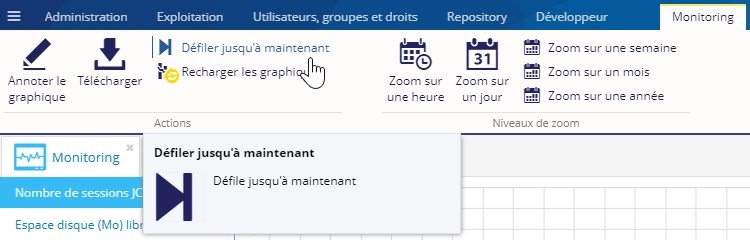
Défiler jusqu'à maintenant
Le bouton Défiler jusqu'à maintenant permet de revenir à l'instant t sur la courbe losque vous avez navigué :
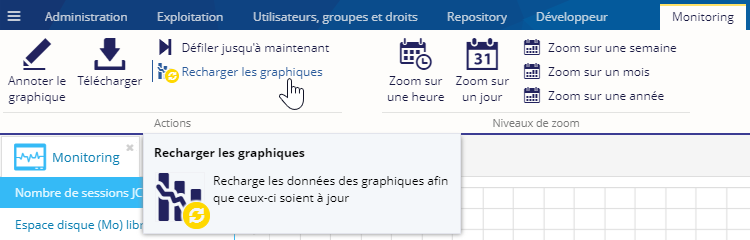
Recharger les graphiques
Pour mettre à jour les graphiques, cliquez sur le bouton Recharger les graphiques :
Définir le zoom des graphiques
Dans le menu contextuel Monitoring, les boutons Niveaux de zoom vous permettent de définir le zoom de vos graphes :
